Wednesday, September 29, 2010

Participating with OneGeology: Experience, Lessons Learned and Other Tidbits

I recently had the opportunity to "stand up" a WMS representing a 1:5,000,000 scale geologic map of North America for integration into a platform called OneGeology.


OneGeology, whos mission statement is to:

"Make web-accessible the best available geological map data worldwide at a scale of about 1: 1 million, as a geological survey contribution to the International Year of Planet Earth." (see: http://onegeology.org/what_is/mission.html)

 aims to:
  • create dynamic digital geological map data for the world.
  • make existing geological map data accessible in whatever digital format is available in each country. The target scale is 1:1 million but the project will be pragmatic and accept a range of scales and the best available data.
  • transfer know-how to those who need it, adopting an approach that recognises that different nations have differing abilities to participate.
  • the initiative is truly multilateral and multinational and will be carried out under the umbrella of several global organisations.   (see:  http://onegeology.org/what_is/objective.html)

The process for contributing to this worthy effort was pretty interesting and I wanted to share this experience a bit.

To begin with, the map we were submitting was actually a replacement for an existing geologic map of North America which only covered the southern portion.  The previous WMS was served using Map Server while our new one was being powered with ArcGIS Server 9.3.1.  This was quite the test for AGS given the outstanding performance of Map Server with regard to WMS serving.  In an effort to boost performance without doing a bunch of map authoring and data processing, we performed a couple of interesting tricks that I outlined in some detail in a previous post.

Basically, participation with the OneGeology platform can occur at several tiers, each basically correlated to functionality.  Our participation was of the first tier, that being simply contributing a WMS.  This experience was not trivial.  Even though WMS is technically a "standard," there is still enough wiggle in the spec that a specific implementation is needed to ensure interoperability.  The folks at OneGeology have done a outstanding job with this and have documented, in detail, requirements for how WMS services need to be configured for integration into their system.  Our specific instances are here:

http://certmapper.cr.usgs.gov/arcgis/rest/services/one_geology_wms/USGS_Geologic_Map_of_North_America/MapServer -- raster one

http://certmapper.cr.usgs.gov/arcgis/rest/services/one_geology_wms/USGS_Geologic_Map_of_North_America_GFI/MapServer -- vector one for getFeatureInfo requests only

And finally the portal.  It is a really nice application and serves as a great demonstration of "mashing up" distributed data services that originate throughout the globe.  It is really pretty astonishing, given the wide range of participating organizations.
OneGeology Portal Depicting Geologic Map of North America


Tuesday, September 7, 2010

WMS GetFeatureInfo Request Rewrite with Apache mod_rewrite (ArcGIS Server, Performance)

We had an interesting issue to deal with with regard to a WMS getFeatureInfo request with a particular WMS webmap service using ArcGIS server.  This issue had to due with performance.  The map service was of the Geologic Map of North America which contained very complicated geometries, cartography, etc so you can image the performance of dynamically generating images for WMS getMap requests from this bad boy.
View of Geologic Map of North America WMS Service in GAIA 3.4

We could have done a whole bunch of data processing such as scale dependent rendering, generalizing layers, etc (which would have been the right thing to do) but didn't really have the time or resources to do so.  Another solution you may be thinking was to cache the service but I am not convinced that ArcGIS Server caches work for WMS getMap requests given the bounding box geometry for the getMap requests are dynamic and may not match the scale and dimensions of the cache but that should be left to an entirely different discussion.

The next best thing was to rasterize the data and basically serve getMap requests based on a rasterized version of the data (in the map document itself).  This helped with performance dramatically but introduced a new issue.  Given that is was based on rasterized data, attribute data was now absent eliminating the ability to serve getFeatureInfo requests.  Our solution for this was to simply serve getFeatureInfo requests with a different service than that which serviced getMap requests.  Two services responding to different requests.  The WMS getCapabilities spec implements this capability by allowing you to simply specify an alternative OnlineResource xlink:type="" value for getFeatureInfo requests.  This works great for most clients but some don't adhere to this so we were forced to forward getFeatureInfo requests made to the original WMS service (containing the rasterized version of the data) to the new service.  Given this scenario, the base URI's for each service were:

http://certmapper.cr.usgs.gov/arcgis/rest/services/one_geology_wms/USGS_Geologic_Map_of_North_America/MapServer -- raster one

http://certmapper.cr.usgs.gov/arcgis/rest/services/one_geology_wms/USGS_Geologic_Map_of_North_America_GFI/MapServer -- vector one for getFeatureInfo requests only

To do this, we used apache mod_rewrite.  Now apache mod_rewrite is not for the faint of heart.  It is powerful but takes some time to work through.  Oh, and get your favorite regular expression cheatsheet ready because you will need it.

Anyway, here is the syntax we used to solve our problem:
The RewriteCond statement sets the stage.  In limits the scope of the following RewriteRule.  In this case, it looks for a query string variable that contains a value of "GetFeatureInfo" (we had to do some pattern matching stuff to account for caps or nocaps and to make is more explicit but that is too much for this post).  The RewriteRule then matches the first statement and replaces it with the second.  In our case, it tries to match:

/arcgis/services/one_geology_wms/USGS_Geologic_Map_of_North_America/MapServer/WMSServer 

and replace it with

http://certmapper.cr.usgs.gov/arcgis/services/one_geology_wms/USGS_Geologic_Map_of_North_America_GFI/MapServer/WMSServer. 

We actually used regular expression stuff to match it but this does the same thing and is easier to understand.  The final thing you will notice is the [P] modifier.  The replacement statement is actually mapped to a local file system location.  In our case, we needed to forward explicitly to a reverse proxy server so a fully qualified URI with the [P] does this.

Thanks to @GISBrett and @jasonbirch for suggestions and moral support on coming up with this solution :-)

Tuesday, June 29, 2010

ArcGIS Server JavaScript API For Beginners: Populating DOJO FilteringSelect

The more I work with it, the more I like it, that is, the ArcGIS Server JavaScript API.  It has some real funkyness that is hard to get use to at first (loose or no typing, dynamic nature, callbacks, etc) but once you get going, it is pretty slick.  Given this, I am going put up a few posts in the coming weeks that illustrate very simple samples that I think are useful.  These aren't elegant, OO examples, just examples so all JS pros out there will probably find these post of little use.  They are based on the ArcGIS Server JavaScript API 2.0 (and ArcGIS 10).

Generally speaking, usability is often the single most important factor dictating the success or failure of your geoweb application. Make it simple and fool proof and guide the user through the workflow or task. If they get confused, you have failed. One component that can be used to help accomplish this is a pre-populated drop-down/search box that auto-completes. DOJO, the toolkit that the ArcGIS Server JavaScript API is built on, provides a lot of nice components for doing just this. One of these is dijit.form.FilteringSelect. It does a lot of cool stuff which assist in fool proof usability, much more that what is mentioned here. This post addresses how to populate a FilteringSelect dijit with the results of a query, in this case, the query of an ArcGIS Server map service layer’s field value. It is assumed that you know the very basics of using the ArcGIS Server JavaScript API, if not, have a look.

Instantiating a FilteringSelect dijit can be done declaratively or programmatically. In this case, we will declare it:

<body class="tundra">
    <input dojoType="dijit.form.FilteringSelect"
           id="lineid"
           searchAttr="name"
           name="widgetName"
           onChange="doSomething(this.value)">
</body>


where the id attribute is used to identify the component in the document, the onChange attribute defines the event handler when the component is changed and the searchAttr attribute, well, we will discuss that later. Remember to define your component before declaring it using dojo.require("dijit.form.FilteringSelect"). Now that the component has been declared, lets populate it. A best practice for initializing web maps along with selected stuff that goes along with them (such as our FilteringSelect component) is to define a function that is called when the the page is loaded. This is handled nicely using the dojo.addOnLoad() function. Something like:


    //Our main initialization function, called at just the right time
    function init () {
        //Create your query
        var queryTask = new esri.tasks.QueryTask(<query task rest endpoint>);
        //set the onComplete event handler, in this case, when the query is complete, call initLineID,
        //production code would handle handle the error callback as well
        dojo.connect(queryTask, "onComplete", initLineID);
       
        //build and execute your query
        var query = new esri.tasks.Query();
        query.outFields = [<name of the field you want>];
        query.text = "all";
        query.returnGeometry = true;
        queryTask.execute(query);

     }
     
     dojo.addOnLoad(init);


In the snippet above, we are basically building a query task and executing it.  For details on the queryTask works, have a look at the queryTask object (everything is an object is JS, another kind of weird thing to get use to).

Now the good stuff, populating the FilteringSelect component.  We first need to bind the completion event of the query to some logic that will populate the FilteringSelect component.  This is done using a handy little dojo function:

     dojo.connect(queryTask, "onComplete", initLineID);

which basically says once the queryTask fires the onComplete event, take the results and run with them in a function called initLineID.  Here is initLineID:

function initLineID(features) {
        var lineIdObjects = [];
        dojo.forEach(features.features, function(feature) {
            lineIdObjects.push({"name": feature.attributes.field_name});;
        });
       
        //Build the appropriate data object for our data component
        var data = {
              "identifier": "name",
              "items": lineIdObjects
        }
       
        //bind the data object to the datastore
        var lineDataStore = new dojo.data.ItemFileReadStore({data: data});
   
        //bind the data store to the FilteringSelect component
        dijit.byId("lineid").store = lineDataStore;
     }


Basically, we take the queryTask results, in this case referred to as "features" and refactor them into a ItemFileReadStore which is then bound to the FilteringSelect component.  Most of the UI components in DOJO work best consuming data from one of the DOJO data stores, in this case we are using the ItemFileReadStore.  ItemFileReadStores basically house JSON data formatted in a specific way.  Unfortunately, direct REST requests made to the ArcGIS Server Rest API don't return JSON formatted in this way which would have made things very easy but we will leave that for another time.

Because of this, we basically need to refactor our queryTask's returned features in a way that the ItemFileReadStore likes (see, "Reading JSON Data with DOJO").  We do this by creating an array object and populating it by stepping through each queryTask feature and adding it to the array as a name/value pair (one of the ItemFileReadStore format requirements).  We then build a generic object called "data" with 2 properties, "identifier" and "items".  The identifier property tells the ItemFileReadStore what handle to look for in the name/value pairs collection (our array).  In our case, we named each result record "name."  The second property called "items" is assigned our array.  Upon completion of this generic data object, we then simply bind it to the ItemFileReadStore using some named property.  In this case, we are calling it "data" as well.  Our final step is to find our FilteringSelect component in the document using the dojo.byId function and to assign its store property the ItemFileReadStore we created.  Thats it...

One final note on what I skipped earlier.  Remember that we assigned each of our queryTask feature values a attribute name called "name" and assigned our required "identifier" property and value of  "name" as well:
   
        var lineIdObjects = [];
        dojo.forEach(features.features, function(feature) {
            lineIdObjects.push({"name": feature.attributes.field_name});;
        });
       
        //Build the appropriate data object for our data component
        var data = {
              "identifier": "name",
              "items": lineIdObjects
        }


this is the handle that is used by the FilteringSelect component to find where to look for the data.  We tell the FilteringSelect component where to look for the data values using the searchAttr attribute:

    <body class="tundra">
    <input dojoType="dijit.form.FilteringSelect"
           id="lineid"
           searchAttr="name"
           name="widgetName"
           onChange="doSomething(this.value)">
     </body>


You can download this sample here


Wednesday, April 7, 2010

Twitter Use For Geo Pros: The Good and the Bad

I have used Twitter for about a year now and have 225 followers. I started using it in a professional capacity, trying to learn from and connect with people in the geosphere. I work in a technical capacity professionally but don't really consider myself a bleeding edge techie or a gadget for gadget sack kind of person. Basically, what can help me do my job better. Anyhow, after a year of use, I feel I am credibly positioned to give a critique on its effectiveness and usefulness for geopros.

I have tried to keep my opinions truly objective. I have received a fare amount of grief by a variety of people in my life regarding its use. My "traditional" colleagues think I'm nuts. Others just don't understand. My favorite line is "What's with this Twitter crap". My wife quivers each time that annoying Tweetdeck chirp chatters from my laptop sitting in my home office (make sure to turn that off). Given this disclosure, here is my take:

The Good
  1. If you want to learn about stuff fast, Twitter is the best. Anything, I mean anything, that you may be interested in, is posted to Twitter first. Here's the trick, you have to follow the right people (and finding those people can be easy I guess) . Examples of this stuff includes:
    • The latest release of your favorite software,
    • What colleagues are up to (that very instant)
    • What people are saying at any given public venue (conferences, press conferences, etc...)
    • Attending events such as conferences remotely
    • What's new with... (you name it)
    • Personal opinions about... (you name it)
  2. What government agencies are up to: The current federal administration has embraced social media which has resonated with many state and local governments. Using Twitter is a good way to keep track of what is going on within your government.
  3. Support: I recently posted a question to Twitter about a problem I was having with ArcGIS Server. An expert engineer (thanks @keyurva) working for ESRI, replied instantly to help. I can't imagine how long it would have taken via a formal incident request.
  4. Networking: I have virtually met a number of people that I never would have met otherwise. In some cases, these virtual relationships have lead to real ones. An example relates to my part-time role as a faculty member at a local University. Using Twitter, I was able to pursue a potential guest lecture from a great individual (thanks @agup). In addition, staying connected is much easier and quicker, granted without alot of detail but in a networking setting, it is better than the alternative.
  5. Data Mining: I use TweetDeck which is a pretty good tool (UberTwitter remotely). With TweetDeck, I can mine a tone of info with little effort. I swear I am observing the Matrix:-).
The Bad
  1. Continuity: I have followed alot of people who have been great but, eventually abandon their Twitter persona. I can relate to this because it takes a bit of work to continue posting, you have to buy in a bit. Also, it is easy to think this is the coolest thing when you start and then that thought fades. You fire up your account and tweet like crazy and then your.....tweets.......start............to..............slow...................down................................until...
  2. I will be honest here, it is a bit narcissistic and it can kind of turn into a popularity contest if you let it. "How many followers can I get." It shouldn't be about this but we are all human. We need validation. However, if you are tweeting from your kids birthday party, the dinner table, or tweet more that lets say 15 or maybe 20 times a day (I would say less but...), you might want to lay off. Just my opinion. (Quick tip: if you want alot of followers, just tweet about different stuff, sports, religion, hobbies, politics, etc).
  3. Data Mining: This is a benefit and a curse. While there is alot of data and information to mine and some tools do a better job than others, alot of it is still nonsense.
  4. There are many more people within professional circles not using it than are. Sure within some communities (techies, developers, etc) the use is higher but I was recently at the ESRI PUG conference and during the plenary, the presenter asked who was using Twitter. I would estimate the maybe 10% of the crowd of 1200 attendees raised their hands. Just one anecdotal example.
  5. It seems to be lacking in security. I have noticed a few accounts I follow have been "defaced." 3 out of 225 is pretty bad.
  6. Is this going to continue? Whats next? Am I wasting my time? I'm not in tune with the future of Social Networking so I will leave that up to those who are.
P.S. I said I was going to try and keep this objective but I can't help myself. For professional networking, Twitter and LinkedIn are great but to me, FB is cramming a square peg into a round hole. I can't stand the FB UI and think it is best left to "Johnny just cut his first tooth" and "I just made the biggest..."

Monday, March 1, 2010

Using ArcGIS Explorer (900) for Presentations

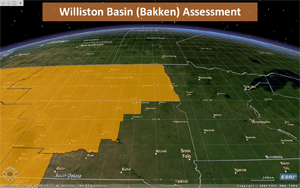
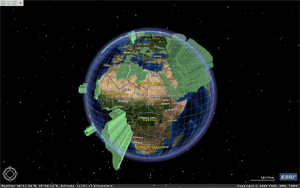
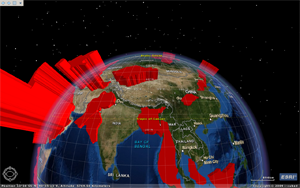
I recently had the opportunity to present at the 2010 ESRI Petroleum User's Group (PUG) meeting in Houston. My talk was nothing earth-shattering, basically just a intro/tour of the work our team had been doing the previous year. My time-slot was short, 25 minutes with 5 minutes of Q & A. This was fine with me. Given my short attention span and propensity towards ADD behaviors, I actually prefer quick talks. Faced with this and the fact that my talk didn't contain much factual information, I wanted to try something a bit different standard slides. Although I hadn't worked with ArcGIS Explorer (AGX) much, I remembered hearing the ability within build 900 to perform some short of slide show so thought I would give it a try. The global nature of the materials I wanted to present also lended itself nicely to this platform.


ArcGIS Explorer Build 900

The process to do this is was pretty simple. The workflow is basically to:
  1. Stylize layers in either ArcMap or ArcGlobe (for 3D stuff).
  2. Build an AGX project
  3. Navigate to various "views" and capture "slides"
  4. Place titles on "slides" if desired
  5. Activate the show by simply hitting the go button.
The Cool
  • Wow factor provided by the geobrowser platform, especially to non-geo audiences.
  • Super easy to do, very intuitive workflow.
  • From a presentation flow persepective, the platform allows for a nice, smooth talk with soft transitions.
  • Informative media, not a boring slide of text or some dopey picture from istock.
  • Features can be identified, both to the data layer's attribute table or hyperlink field
The Not Very Cool
  • Because it is so easy, it isn't very feature rich. Aside from being able to add titles, there really isn't any way to annotate your slides
  • It is pretty buggy. The identify functionality works about 90% of the time, guaranteed to not work when it really counts.
  • Identify only works on "data layers" but not references created by layer files. This is problematic because you need to use layer files for rich symbology (from ArcGlobe). The work around for this is to add the layer as a data layer, make it 100% transparent, then add it with the desired symbology (using the layer file) for viewing.
Results